

Momentum Indicators NT7: RSI, CCI, and SMI… Upgraded!
Now including Divergence Detection, Trend Bar, Alerts, and more to make analysis easier!
We understand that not all trader’s personalities are the same and not all trading instruments behave the same. Thus, we include multiple momentum indicator options to suit the trader’s needs and preference.
They are intended to be used in conjunction with the Price Action Analyzer and our other tools, to identify divergence and momentum changes as signals emerge at reversal areas.
These upgraded indicators include:
- Relative Strength Index (RSI)
- Commodity Channel Index (CCI)
- Stochastic Momentum Index (SMI)
It’s recommended to only use one of these three indicators at a time in order to avoid confusion, mixed signals, and information overload.
Purchase The Momentum Suite for NinjaTrader 7
UppDnn Swing Toolkit PRO Suite
These momentum indicators are part of the UppDnn Swing Toolkit PRO suite of indicators.
Learn More
Looking for RSI/CCI/SMI for NT8?
We offer our Momentum Indicators for both NinjaTrader 7 and 8.
RSI/CCI/SMI for NT8Relative Strength Index (RSI)
Developed J. Welles Wilder, the Relative Strength Index (RSI) is a momentum oscillator that measures the speed and change of price movements.
Traditionally, and according to Wilder, RSI is considered overbought when above 70 and oversold when below 30.
The RSI can be used to identify strength or weakness via divergence, failure swings, center-line crossovers, and the general trend.
The neoRSI upgrades the traditional RSI by including:
- Auto-Divergence Detection (with alerts)
- Advanced Coloring
- Two Moving Averages
- Presets
Auto-Divergence Detection
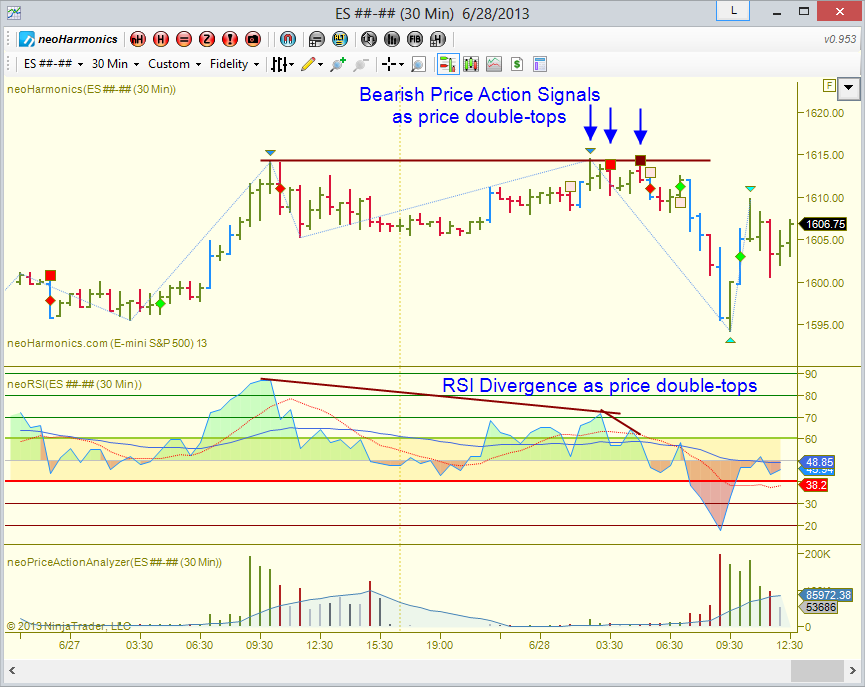
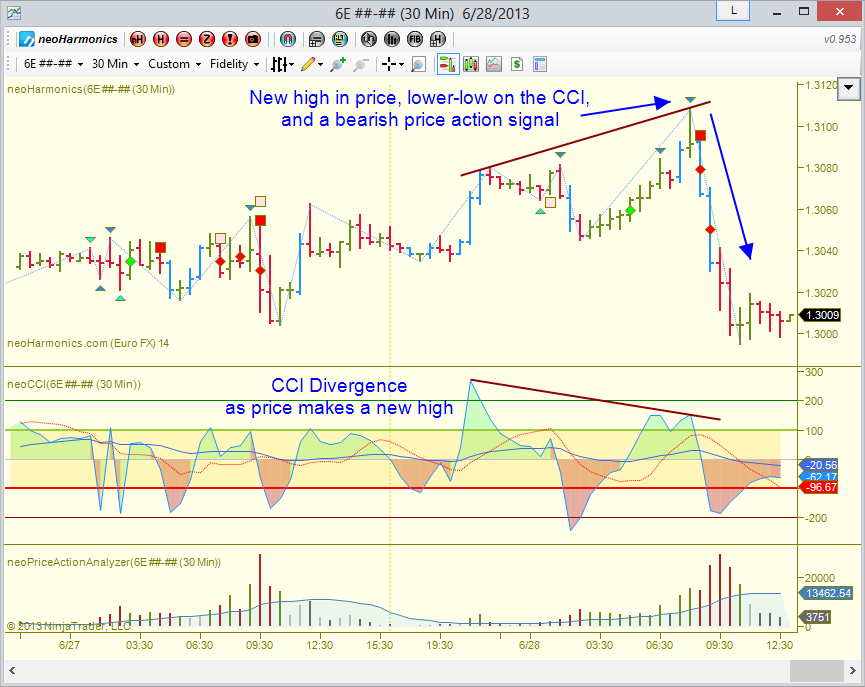
The neoRSI has the ability to automatically highlight divergences (as shown in the screenshot)!
Normal divergence occurs when price makes a higher high, but the RSI fails to make a new high along with it. This can be a sign of weakness! The bullish scenario is when the market makes a new low, but the RSI fails to make a new low. This can be a sign of strength.
Hidden divergence occurs when price makes a higher high, but the RSI makes a lower low. This type of divergence indicates underlying strength of an uptrend.
The neoRSI handles both of these types, as well as a “sensitivity” setting.
Not always looking at the chart? Add a customizable audible alert when divergence is detected!
(Visibility and appearance of lines and arrows are customizable)
Failure Swings
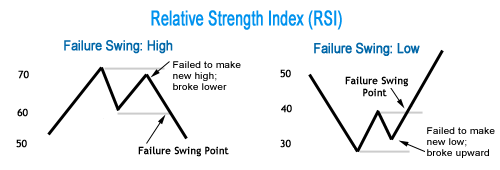
When in an up trend, the RSI makes higher highs and higher lows, just like price does. However, the RSI can act as an trend-change-early-detection-system when a Failure Swing occurs (see diagram below). Often this behavior will be coupled with divergence.
Wilder refers to these as a “very strong indications of a market reversal.” As shown in the diagram below, this is a great method to confirm buy and sell points.
Advanced Coloring
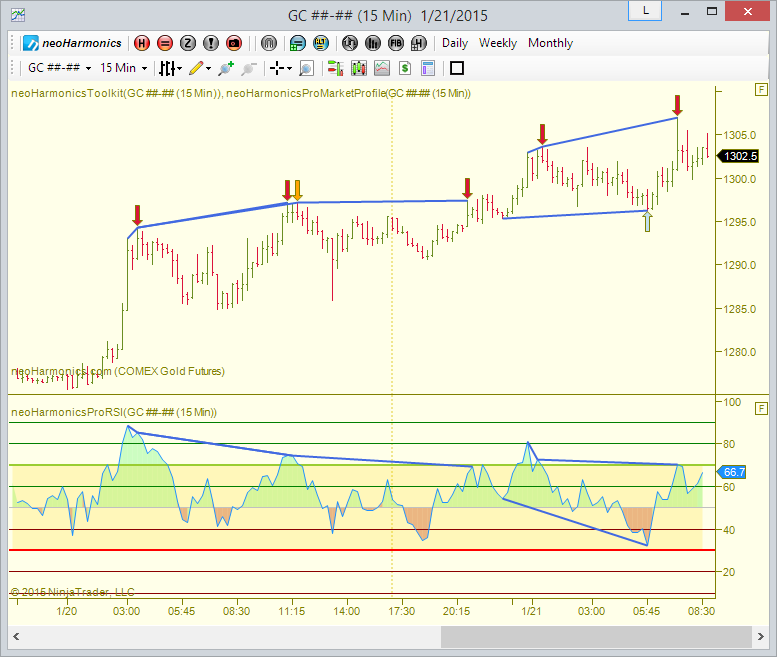
In order to tweak the indicator to your needs, the neoRSI has an advanced “Color Mode”. This allows you to color the background and lines to suit your style of analysis.
One option is to color the area between the RSI and the middle line like the screenshot above.
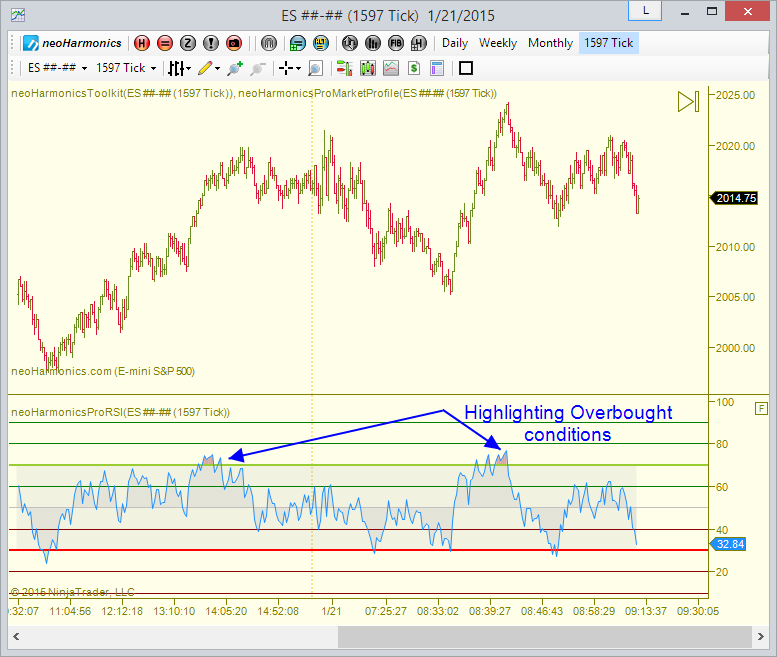
If you are treating the RSI like an “Overbought/Oversold” oscillator, you can color the lines like this example to the right.
Personally, I like the “Middle Zone Color” to be Silver when in “Overbought/Oversold” mode and Gold when colored based on the mid-line (all customizable).
The horizontal lines are also customizable in appearance and position.
Moving Averages
The neoRSI also has the ability to add two, customizable moving averages.
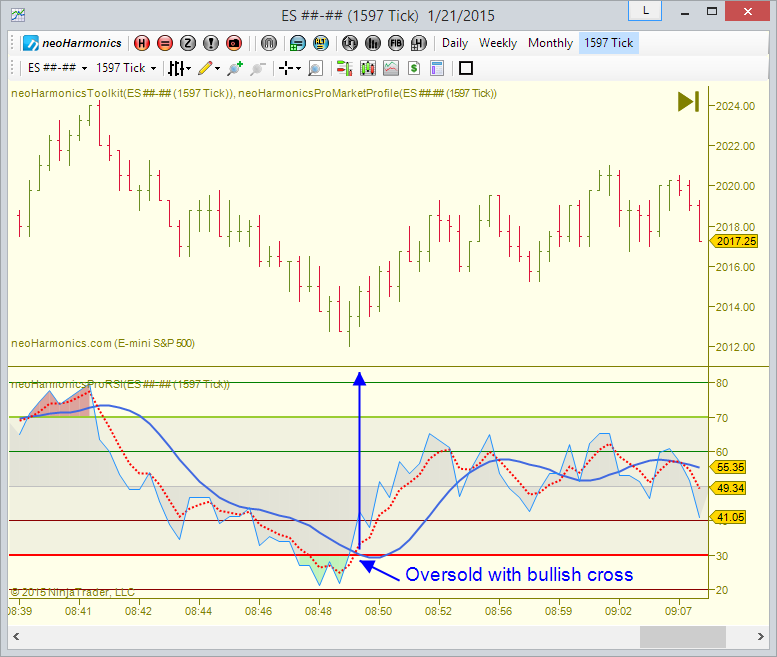
In the example to the right, the larger trend is bullish, so we wait for a pullback to an oversold condition (you can see the RSI below the “oversold” level (30), which causes the green background to output).
Then, we wait for a cross of the moving averages (dark blue and red lines) to give us a trigger into the trade long.
When configured correctly for your instrument and time frame, these moving averages can offer a powerful trigger!
Presets
Finally, the neoRSI comes with some “preset” options (Fast, Medium, and Slow), but feel free to use your own custom settings.
For low time frames, there may be many bars in a pullback or swing (20-50 bars, for example). Thus, it makes sense to adjust the indicator to react slower (slow setting). Conversely, for higher time frames (daily/weekly, etc), each pullback may only be 5-15 bars, so your indicator needs to react quickly (fast setting).
Note: All three of our upgraded momentum indicators (RSI, CCI, SMI) are sold bundled together.
Commodity Channel Index (CCI)
Developed by Donald Lambert, the Commodity Channel Index (CCI) can be used to identify a new trend or warn of extreme conditions.
Lambert originally developed CCI to identify cyclical turns in commodities, but the indicator can successfully applied to indices, ETFs, stocks and other securities.
In general, CCI measures the current price level relative to an average price level over a given period of time.
CCI is relatively high when prices are far above their average. CCI is relatively low when prices are far below their average.
In this manner, CCI can be used to identify overbought and oversold levels. Like the RSI, it can also be used to identify divergence (as shown).
The neoCCI upgrades the traditional CCI by including:
- Auto-Divergence Detection (with alerts)
- Advanced Coloring
- Two Moving Averages
- Presets
The neoCCI has similar features like the neoRSI above. To learn more about these features, please see the RSI section above.
Note: All three of our upgraded momentum indicators (RSI, CCI, SMI) are sold bundled together.
Stochastic Momentum Index (SMI)
Introduced by William Blau in 1993, the Stochastic Momentum Index is similar to a traditional Stochastic, but is quicker to react.
As with the RSI and CCI, you can also use the SMI to identify divergence. However, the SMI does not work as well as the RSI and CCI in this regard. Instead, it is primarily used as an “Oversold/Overbought” oscillator.
The neoSMI upgrades the traditional SMI by including:
- Trend Bar
- Crossover alert
- Overbought/Oversold Coloring
- Auto-Divergence Detection (with alerts)
- Presets
Where the SMI differs from the RSI and CCI is it is primarily used as an “Oversold/Overbought” oscillator. Keep reading to learn about the neoSMI special features!
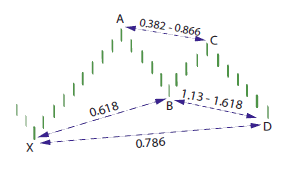
As with any entry technique, the location of the signal is extremely important! The trigger must happen at a reversal area (ex: symmetry, a harmonic formations, etc.).
Overbought / Oversold
As with most oscillators, there is an overbought and an oversold condition.
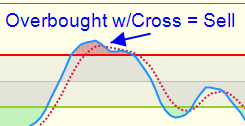
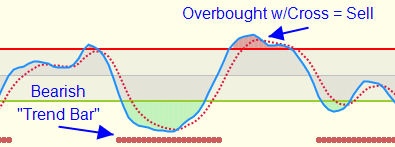
A common technique is to use the crossing of the “SMI” line and the “Average SMI” line as an entry technique (after an overbought or oversold condition). See screenshot at right.
As with all entry techniques, the location is extremely important! The signal must happen at the right price level as well (based on a harmonic formations, for example).
Trend Bar
One problem with oscillators (or any entry technique) is remembering to focus on trend (and ignoring counter-trend signals). In order to help remedy this, we added an optional “Trend Bar” feature (unique to the neoSMI indicator).
When the trend is down, a series of dots will appear on the bottom of the indicator, meaning only overbought conditions should be watched (and oversold conditions ignored).
When the trend is up, a series of dots will appear on the top of the indicator, meaning only oversold conditions should be watched (and overbought conditions ignored).
It’s important to note that the Trend Bar will not appear when the SMI is in the overbought or oversold areas (this is normal). The latest signal is the current signal.
However, when there is a bullish Trend Bar and the SMI travels from oversold and back to overbought, it’s a good idea to wait until another bullish Trend Bar is established before taking another long trade (vice versa for a bearish setup).
As with any trend indicator, it’s important to understand where the support and resistance levels are from higher time frames, since this could mean the end of a trend on the lower time frames!
In other words, the Trend Bar may still say bullish and be slow to flip bias after hitting a higher-time-frame resistance level. As a professional trader, you must be aware of the context of every trade!
Crossover Alert
To help alert you when there is a cross of the SMI line and the Average SMI line, the neoSMI includes a customizable audible alert.
This includes the ability to alert on:
- All Crosses
- Only Overbought/Oversold Crosses
- OB/OS Crosses in direction of Trend Bar (recommended)
Presets
Like the neoRSI and neoCCI, there are some optional presets to calibrate the indicator to the type of chart or symbol of your chart.
This offers some predefined settings for “fast” (good for longer time frames that have fewer bars in a pullback) and “slow” (good for shorter time frames with more bars in a pullback). You can also define your own D and K settings.
IMPORTANT: The preset setting also affects the “Trend Bar”, so be sure this is adjusted for the symbol and time frame of your chart!
Note: All three of our upgraded momentum indicators (RSI, CCI, SMI) are sold bundled together.
Contact Info
Testimonials
-
“I your tools in my day trading routine and I have to admit that it really, really helps me to be a better and profitable trader.
So, thank you for all the hard work you’ve done, it is really appreciated.”
-
“May I say I am enjoying the trial. It is a well thought out software and the best I have seen for [Swing Patterns].”
-
“I could not pass up the opportunity to commend you on the presentation with NinjaTrader Ecosystem and [UppDnn]. Daniel, you have certainly added a dimension to ‘consummate professional.’ I have participated in several sessions of webinars with NinjaTrader and others. Your presentation was the most concise, easy to understand, follow and absorb than any I have seen from anyone. Never did you lean to any type of ‘selling mode’ but rather the most concise explanation of the math and mechanics. You were prepared and focused and made the most ardent use of time management I have seen to date in anyone that represents themselves as knowledgeable of the markets and/or business.
My acquisition of the [UppDnn]coupled with the NinjaTrader has daily expanded into a very strong and unemotional knowledgebase for execution. I wish to express my gratitude for the opportunity to be a participant of your amazing technology application. I am learning constantly and still have much more to accomplish. Simply……Thank you for showing your excellence.”Lauren S.
Customer -
“I greatly appreciate all of the hard work that you both have done over the years to be able to produce such an amazing platform! I cannot describe how easy you guys have just made my trading life become. I really feel like I was just walking around blind for all these years and now you guys have given me the gift of vision. I truly look at the markets in a completely different way.”
“I have been trading for the last 10 years, with varied results, and I have never had such a relaxing day trading as I have today.”
Dave M.
Customer -
“Loving it!! I don’t know how people can trade without this software. Thank you so much for creating it. You made my day!!!”
Patty E.
Customer -
“Thank you for your extensive reply. … I was touched with the effort you took to answer my email. Hence this reply to you.”
Avi M.
Customer -
“As a result of [your explanation] I took a long position that netted me 100 points that I would not have previously taken without this understanding. Your software is helping me to make money every day. I have never seen such a great piece of trading software before.”
“Mate your software is absolutely astonishing. I know I’ve said it before but it’s truly a work of art… It’s mind boggling how I can draw a pattern and price will get within a couple of ticks of the dotted line in the PRZ… I am literally making money with your software every day. I don’t know how I ever traded without it.”
Geoffrey W.
Customer -
“I’ve been with you since 2012 and have appreciated everything you have done along the way – I use your tools on both NinjaTrader 7 and NinjaTrader 8 every day and consider you as one of the best programmers out there. Thanks for everything you have done !!”
Eric M.
Customer -
“I think I may have “greatly” underestimated the power of the Symmetry tool. Your ease of use of that tool is amazing.”
David C.
Customer -
“Thanks mate. Amazing tool. Glad I found it.”
Basilius L.
Customer -
“Your updated Market Profile is absolutely fabulous! It installed without a hitch and I’m already making money with it. ” “I’ve come to expect that all of your stuff is simply top notch. From your website to your workbooks to your new video, even a dummy like me can understand it (mostly). While I still have a tremendous amount to learn, I’m on my way to becoming a better trader. I credit you for a good deal of my success. Thank you, Sir. I appreciate you looking out for me. Market Profile is turning out to be a nice feather in my cap. ”
“You already know I’m a big fan. I can’t help but to repeat myself – I am thoroughly enjoying your work dealing with market profile. Until now, MP has always been vexing to me. I’ve witnessed numerous “interpretations” as to how to use MP. All of which either left me scratching my head or didn’t lead to consistent results. Your indicator and instructional video has taken what used to be a mystery and turned it into an asset. The double distribution piece is especially valuable. Thank you. ”
Darrell D.
Customer -
“I have seen (and coded) A LOT of stuff. By far, [UppDnn] is the best I have seen. Whoever does your marketing and web site design is VERY professional. I have looked at all the other NinjaTrader partners who sell Fib/Pattern stuff. In my opinion, yours is the best in both presentation and product. Good job!”
Paul S.
Customer -
“The [UppDnn] Pro Suite has been an eye-opener for me and a guide in my trading plans. Sincerely, it will be hard trading a day without it.”
Adegeji A.
Customer -
“I enjoy your software every single day I work with it. It’s my favorite and ever since I bought it, I have had no need to buy any other!”
Patty E.
Customer

