

Consolidate 19 MA types into one, powerful indicator!
Determine bias based on price in relation to a single MA line or the cross of two MA lines. Optionally, add a band around the lines, in the form of the High/Low averages, +/- 1 Standard Deviation, or a customizable Percentage.
Many choices for whatever the situation.
(Scroll down for detailed descriptions!)
- Ichimoku Kinko Hyo System
- Average True Range Trailing Stop
- Simple Moving Average (SMA)
- Exponential Moving Average (EMA)
- Double Exponential Moving Average (DEMA)
- Triple Exponential Moving Average (TEMA)
- Zero-Lag Exponential Moving Average (ZLEMA)
- Weighted Moving Average (WMA)
- Volume-Weighted Moving Average (VWMA)
- Kaufman’s Adaptive Moving Average (KAMA)
- Mesa Adaptive Moving Average (MAMA)
- T3 Moving Average (T3)
- Hull Moving Average (HMA)
- Triangular Moving Average (TMA)
- Time Series Forecast (TSF)
- Variable Moving Average (VMA)
- Linear Regression
- Equilibrium Moving Average
- Wilder’s Moving Average
Purchase The Moving Average Pro for NinjaTrader 8
Bias Coloring and Alerts
Based on price’s position relative to the average, there are various ways to determine bias.
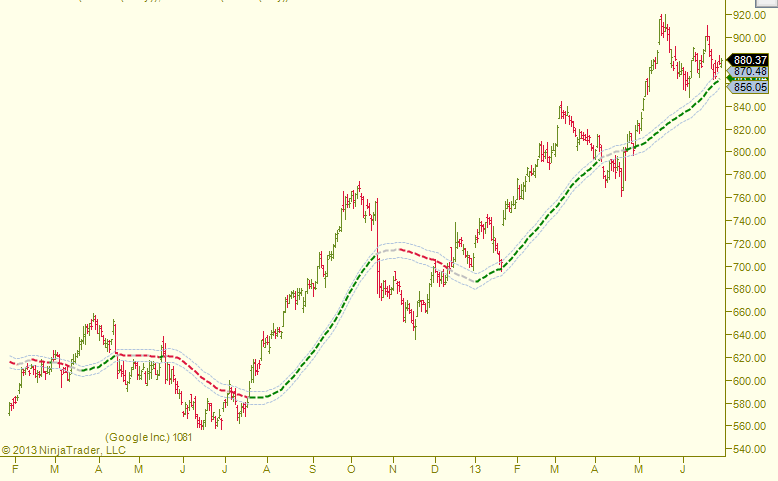
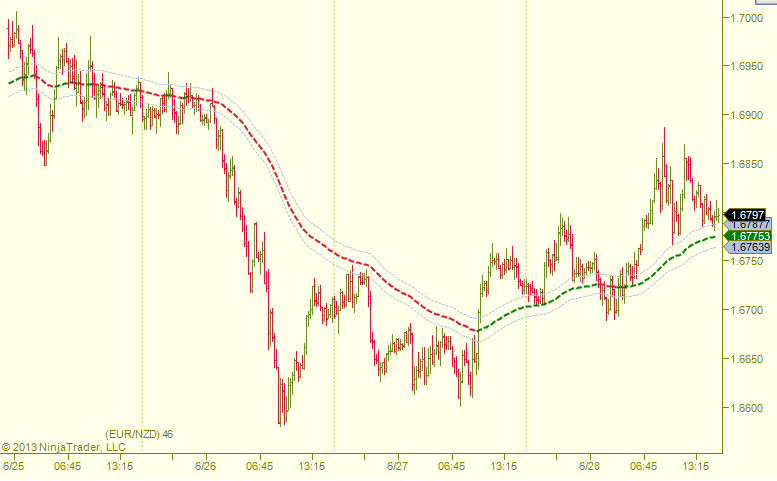
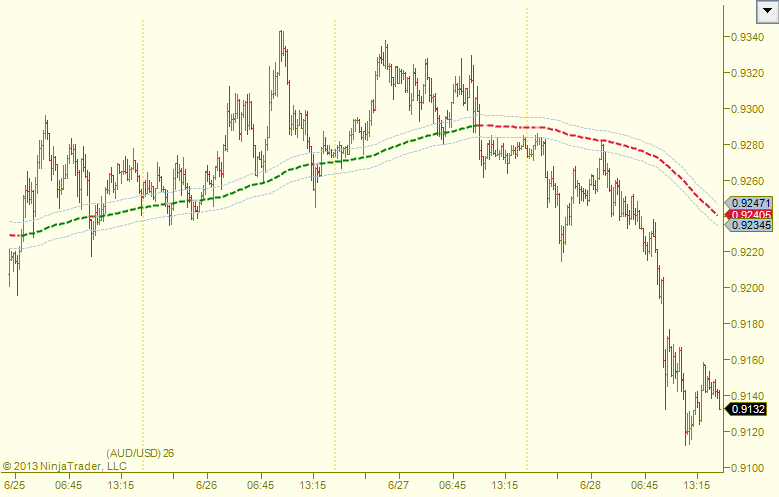
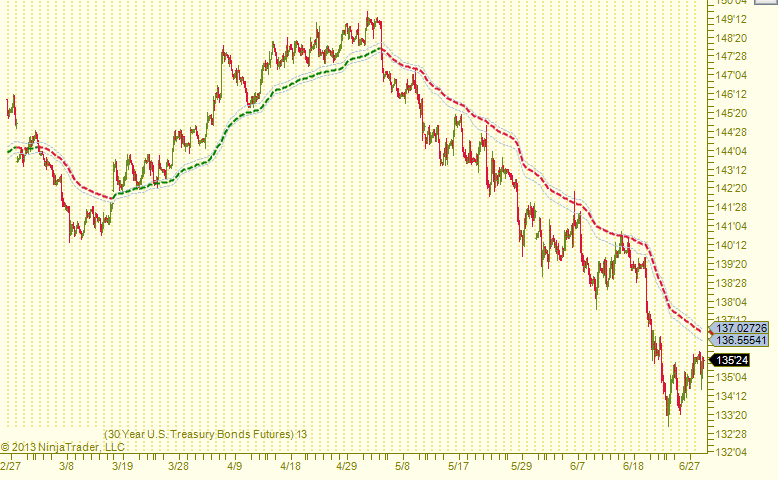
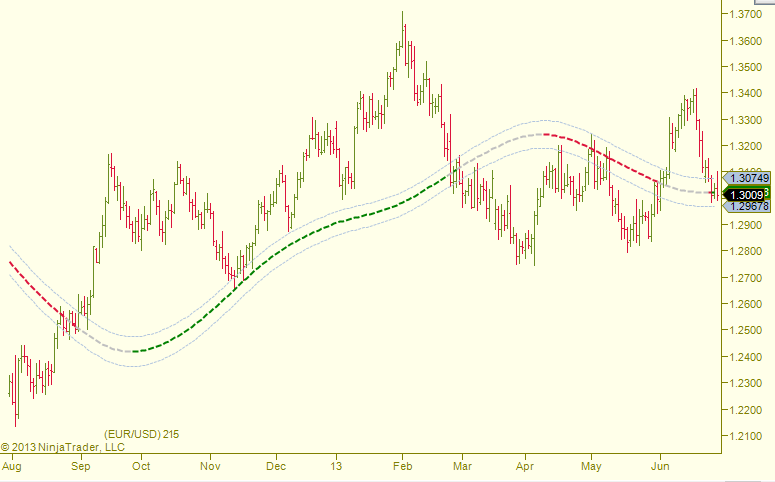
The MA PRO includes ability to color the line and/or the bars based on the bias (see screenshots below on individual MA types for examples).
Bias: Single Moving Average Line
The single MA line bias is based on the following logic:
- Bullish: Price is above the moving average line and line is angled upward.
- Bearish: Price is below the line and the line is angled downward.
- Neutral: Neither of the above are true. For example, price is below the MA line, but the MA is still angled upward (typically seen in slower reacting MAs, such as the SMA or TMA).
Bias: Two Moving Average Cross
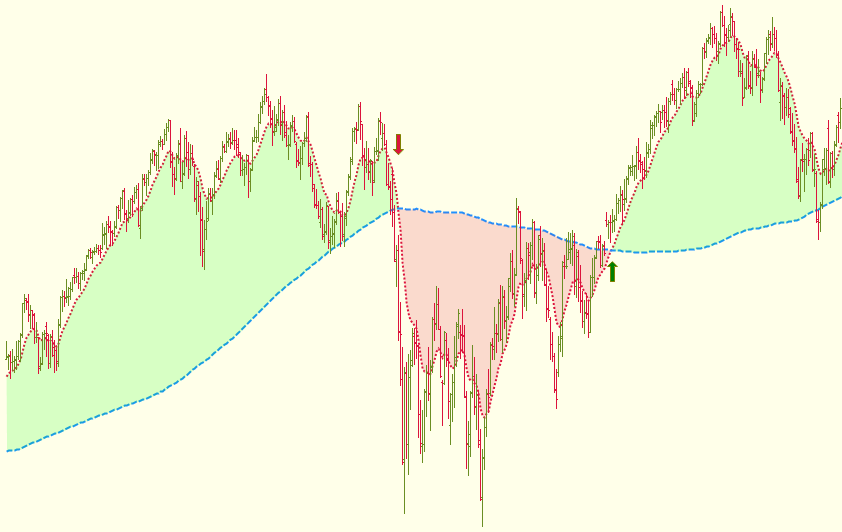
The MA PRO also includes the ability to output two moving averages (fast and slow) creating a “cloud” between them (see screenshot). This filled in area is color coded based on the position of the fast MA compared to the slow MA.
When the fast MA is above the slow MA, it’s a bullish sign. When the fast MA is below the slow MA, this is a bearish sign.
Each moving average can be individually chosen from any of the supported MA types!
Moving Average Cross Alerts
To help highlight when a cross happens, there are various options:
- Output an icon (arrow, triangle, diamond, dot, or square). See screenshot above (click to enlarge).
- Audible alert (customizable).
- Send an email. This requires setting up your email settings within NinjaTrader (more info).
Moving Average Bands
Optional choices for bands around each MA line:
- Average of the Highs and Lows (optional multiplier)
- +/- 1 Standard Deviation (or a multiple of)
- Percentage (customizable)
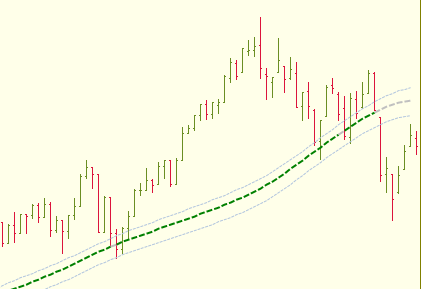
These creates a band around the moving average, which can act as a zone of support or resistance, instead of a single price.
This feature can be disabled or modified within the parameters.
Market Analyzer Scanner
(Please visit our Market Analyzer Template page for more information and other templates!)

Descriptions of the supported MA types.
Each moving average type is unique, yet powerful. Which is right for you?
Ichimoku Kinko Hyo (Ichimoku Cloud)
Included with MA PRO; This is a unique (and involved) system, centered around multiple, specialized moving averages. It’s so involved, it requires its own page!
Learn MoreAverage True Range Trailing Stop
- High for the period less the Low for the period.
- High for the period less the Close for the previous period.
- Close for the previous period and the Low for the current period.
This is a common technique used for trailing stop placement.
Simple Moving Average (SMA)
In other words, this is the average price over a certain period of time, with equal weighting given to each price.
Formula: SMA = (P1 + P2 + P3 + P4 + … + Pn) / n
Exponential Moving Average (EMA)
Current EMA = ((Price(current) – previous EMA)) X multiplier) + previous EMA.
The most important factor is the smoothing constant. 2/(N+1) where N = the number of periods.
10-period EMA = 2/(10+1) = 18.8
This means a 10-period EMA weights the most recent price 18.8%, a 20-day EMA 9.52 % and 50-day EMA 3.92% weight on the most recent price. The EMA works by weighting the difference between the current period’s price and the previous EMA, and adding the result to the previous EMA. The shorter the period, the more weight applied to the most recent price.
Double, Triple, and Zero-Lag Exponential Moving Averages
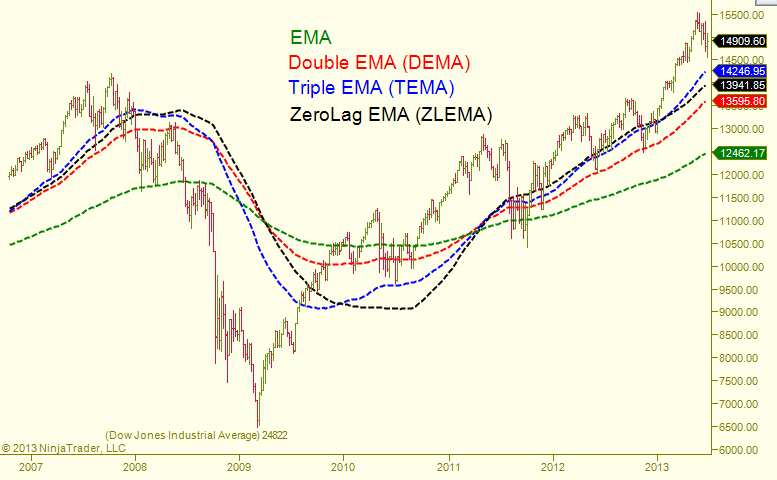
In an attempt to remove lag and to create a smoother moving average, the double, triple, and zero-lag EMAs were developed.
The Triple EMA was developed by Patrick Mulloy and is described in his article in the January, 1994 issue of Technical Analysis of Stocks and Commodities magazine.
The Zero-Lag EMA keeps the benefit of the heavier weighting of recent values, but attempts to remove lag by subtracting older data to minimize the cumulative effect.
To give a comparison, the chart on the right compares these four moving averages. (All are using a setting of 200 periods)
Weighted Moving Average (WMA)
This average is calculated by taking each of the closing prices over a given time period and multiplying them by its position in the data series. Once the position of the time periods have been accounted for they are summed together and divided by the sum of the number of time periods.
For example, in a 10-period weighted moving average, the current closing price is multiplied by 10, previous one by 9, and so on until period 1. These results are then added together and divided by the sum of the multipliers (10 + 9 + 8 + 7 + 6 + 5 + 4 + 3 + 2 + 1 = 55).
Volume-Weighted Moving Average (VWMA)
Kaufman’s Adaptive Moving Average (KAMA)
The KAMA differs from other moving averages as it requires three inputs: Fast, Length, and Slow
This is one of my favorite MA types! (Though, because of its additional parameters, it may require more tweaking to fit it to your symbol/time frame.)
Mesa Adaptive Moving Average (MAMA)
The advantage of this method of adaptation is that it features a fast attack average and a slow decay average so that composite average rapidly ratchets behind price changes and holds the average value until the next ratchet occurs.
T3 Moving Average
The T3 takes the Double-EMA calculation and adds a “factor” which is between zero and one. The resultant function is called the GD, or Generalized Double-EMA. A GD with factor of 1 (and smoothing count of 1) is the same as the Double-EMA. A GD with a factor of 0 (and smoothing count of 1) is the same as a normal EMA. The T3 typically uses a factor of 0.7.
Hull Moving Average (HMA)
Formula: HMA(n) = WMA(2*WMA(n/2) – WMA(n)), SQRT(n))
Triangular Moving Average (TMA)
For comparison, the SMA is calculated like so:
SMA = (P1 + P2 + P3 + P4 + … + Pn) / n
The Triangular Moving Average is calculated like so:
TMA = (SMA1 + SMA2 + SMA3 + SMA4 + … SMAn) / n
Time Series Forecase (TSF)
Instead of a straight linear regression trend line, the Time Series Forecast plots the last point of multiple linear regression trend lines.
This is why this indicator may sometimes referred to as the “moving linear regression” indicator or the “regression oscillator.”
One idea is to use this as a trigger method when it changes directions (and price is at a support/resistance area, in the direction of the larger trend!).
Variable Moving Average (VMA)
Linear Regression
That trend is determined by calculating a Linear Regression Trend line using the least squares method.
This ensures the minimum distance between the data points and a Linear Regression Trend line.
Equilibrium Moving Average
When price begins ranging, the line will go flat and sideways, since the market is in equilibrium (as the name suggests).
Wilder’s Moving Average
Wilder is the father of many popular indicators, such as Average True Range (ATR), Relative Strength Index (RSI), Average Directional Index (ADI), Parabolic SAR.
Purchase The Moving Average Pro for NinjaTrader 8
With so many choices, which MA to use?
There is no single, right answer. It depends on the symbol you’re trading, the time frame, and your trading goals. Some charts are very fast moving with large ranges and others are more slow with shallow ranges.
One idea is to use two (or more) different types of moving averages: one configured to act as support/resistance of shorter-term pullbacks (think Elliot, sub-waves) and another to act as support/resistance for larger pullbacks. If the market breaks both of these, it increases the chances of a trend change.
It’s important to understand that when you go from a 30-min chart to a 15-min chart, for example, you’re essentially doubling the amount of bars (since there are two 15-min bars in each 30-min bar). Thus, any moving average you are using on the 30-min chart is essentially cut in half on the 15-min chart. For example, a SMA(10) on a 30-min chart would need to be a SMA(20) on a 15-min to give you a similar MA line as on the 30-min chart, and so on. This logic works best on time-based charts.
Similarly, there are 5 trading days in a week (ignoring holidays), so going from a daily to a weekly cuts the number of bars by approximately 5. If you are wanting to keep the same MA line values, you have to adjust your MA input accordingly.
Common periods are the 200, 100, and 50, but some lesser known choices are from the Fibonacci Series (…2, 3, 5, 8, 13, 21, 34, 55, 89, 144, 233, 377, etc…)
If you are looking for something to try, the EMA(89) (default) and/or the KAMA(8,16,144) (default) is a good place to start. Also, you can use the above screenshots as examples as well.
Whatever configuration you use, never lose sight of larger time frame trends and support and resistance levels! These can easily trump a lower time frame’s trend. For example, the trend of a 5 minute chart may be bullish, right after the market hits a resistance level from the daily.
Some Final Thoughts…
When the market is trending, moving averages work well and often offer a nice support or resistance area (a return to the mean, if you will).
However, they don’t work well with ranging markets or periods of congestion, because the MA line fails to denote a trend, due to a lack of evident higher highs or lower lows.
Possible Solution? Look at higher time frames and don’t loose sight of the larger trend! Understand that when the market is going sideways, it is typically accumulating or distributing based on larger time frame moves. Use in conjunction with higher level support and resistance levels, instead of lower level, choppy, MA breaks!
Contact Info
Testimonials
-
“I your tools in my day trading routine and I have to admit that it really, really helps me to be a better and profitable trader.
So, thank you for all the hard work you’ve done, it is really appreciated.”
-
“May I say I am enjoying the trial. It is a well thought out software and the best I have seen for [Swing Patterns].”
-
“I could not pass up the opportunity to commend you on the presentation with NinjaTrader Ecosystem and [UppDnn]. Daniel, you have certainly added a dimension to ‘consummate professional.’ I have participated in several sessions of webinars with NinjaTrader and others. Your presentation was the most concise, easy to understand, follow and absorb than any I have seen from anyone. Never did you lean to any type of ‘selling mode’ but rather the most concise explanation of the math and mechanics. You were prepared and focused and made the most ardent use of time management I have seen to date in anyone that represents themselves as knowledgeable of the markets and/or business.
My acquisition of the [UppDnn]coupled with the NinjaTrader has daily expanded into a very strong and unemotional knowledgebase for execution. I wish to express my gratitude for the opportunity to be a participant of your amazing technology application. I am learning constantly and still have much more to accomplish. Simply……Thank you for showing your excellence.”Lauren S.
Customer -
“I greatly appreciate all of the hard work that you both have done over the years to be able to produce such an amazing platform! I cannot describe how easy you guys have just made my trading life become. I really feel like I was just walking around blind for all these years and now you guys have given me the gift of vision. I truly look at the markets in a completely different way.”
“I have been trading for the last 10 years, with varied results, and I have never had such a relaxing day trading as I have today.”
Dave M.
Customer -
“Loving it!! I don’t know how people can trade without this software. Thank you so much for creating it. You made my day!!!”
Patty E.
Customer -
“Thank you for your extensive reply. … I was touched with the effort you took to answer my email. Hence this reply to you.”
Avi M.
Customer -
“As a result of [your explanation] I took a long position that netted me 100 points that I would not have previously taken without this understanding. Your software is helping me to make money every day. I have never seen such a great piece of trading software before.”
“Mate your software is absolutely astonishing. I know I’ve said it before but it’s truly a work of art… It’s mind boggling how I can draw a pattern and price will get within a couple of ticks of the dotted line in the PRZ… I am literally making money with your software every day. I don’t know how I ever traded without it.”
Geoffrey W.
Customer -
“I’ve been with you since 2012 and have appreciated everything you have done along the way – I use your tools on both NinjaTrader 7 and NinjaTrader 8 every day and consider you as one of the best programmers out there. Thanks for everything you have done !!”
Eric M.
Customer -
“I think I may have “greatly” underestimated the power of the Symmetry tool. Your ease of use of that tool is amazing.”
David C.
Customer -
“Thanks mate. Amazing tool. Glad I found it.”
Basilius L.
Customer -
“Your updated Market Profile is absolutely fabulous! It installed without a hitch and I’m already making money with it. ” “I’ve come to expect that all of your stuff is simply top notch. From your website to your workbooks to your new video, even a dummy like me can understand it (mostly). While I still have a tremendous amount to learn, I’m on my way to becoming a better trader. I credit you for a good deal of my success. Thank you, Sir. I appreciate you looking out for me. Market Profile is turning out to be a nice feather in my cap. ”
“You already know I’m a big fan. I can’t help but to repeat myself – I am thoroughly enjoying your work dealing with market profile. Until now, MP has always been vexing to me. I’ve witnessed numerous “interpretations” as to how to use MP. All of which either left me scratching my head or didn’t lead to consistent results. Your indicator and instructional video has taken what used to be a mystery and turned it into an asset. The double distribution piece is especially valuable. Thank you. ”
Darrell D.
Customer -
“I have seen (and coded) A LOT of stuff. By far, [UppDnn] is the best I have seen. Whoever does your marketing and web site design is VERY professional. I have looked at all the other NinjaTrader partners who sell Fib/Pattern stuff. In my opinion, yours is the best in both presentation and product. Good job!”
Paul S.
Customer -
“The [UppDnn] Pro Suite has been an eye-opener for me and a guide in my trading plans. Sincerely, it will be hard trading a day without it.”
Adegeji A.
Customer -
“I enjoy your software every single day I work with it. It’s my favorite and ever since I bought it, I have had no need to buy any other!”
Patty E.
Customer

